Britain’s role in the transatlantic slave trade appears in the History curriculum at key stage 3. You may want to extend the learning here to cover slavery on an international scale, perhaps having learners research and report on incidences of slavery in other countries, at other times in history, or even in the modern day. There may also be some cross-curricular learning, here, if you tie this together with learning about human rights and international law, which appears in the Citizenship curriculum at key stage 4. Read on for some visualisations that will support learning on these topics.
Map of the Slave Population of the Southern United States
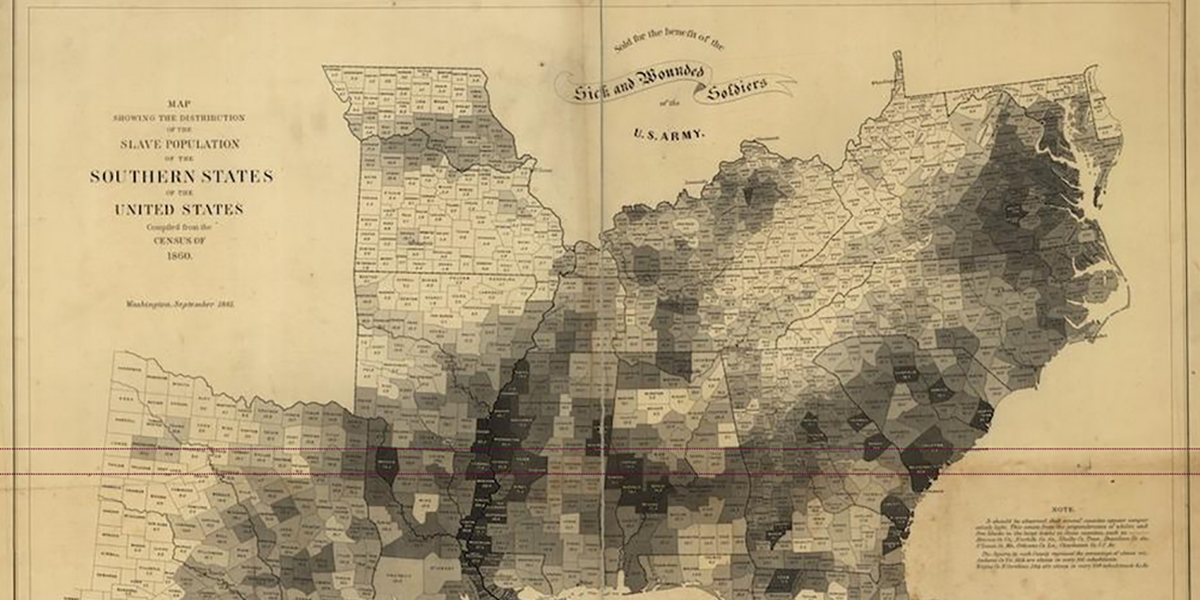
This historical map from the Library of Congress, shows the slave population of the southern United States, using census data from 1860. The map is enhanced with clickable markers that provide textual explanation and a zoomed-in image showing map detail.
Source: The New York Times
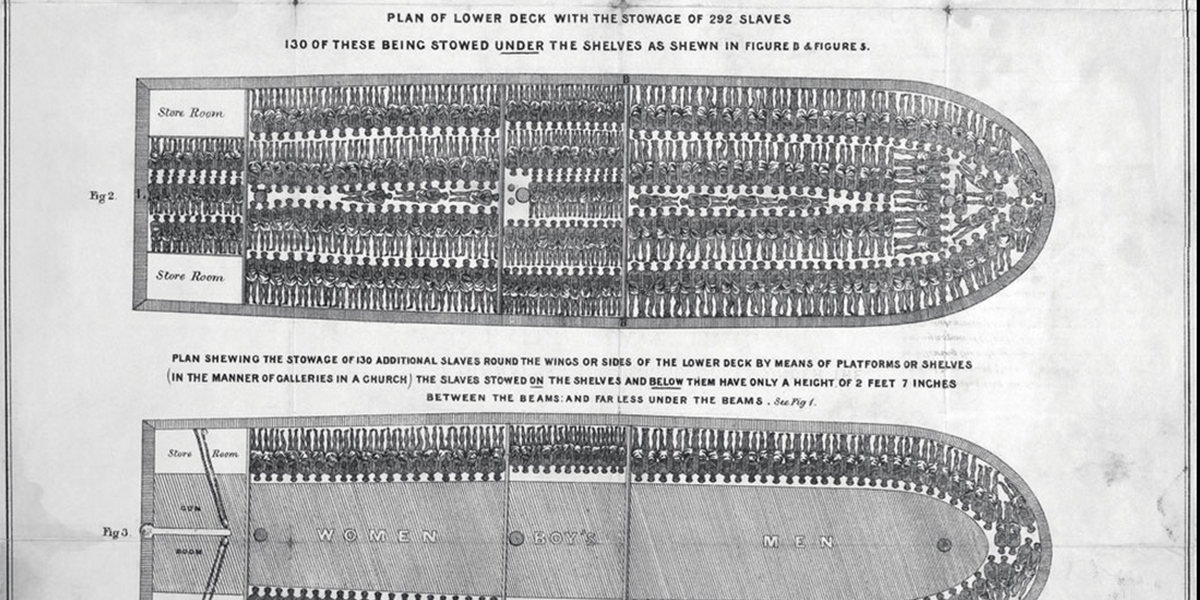
Slave Ship Diagram Used by Abolitionists
It might be interesting to lead a discussion about how visuals change the public perception of big issues like slavery and poverty (which could also lead in to some discussion about Propaganda, using resources like the propaganda timeline).
The drawing of the slave ship Brookes was published in 1788 and widely circulated in Britain, France and the US, showing just how little space slaves were provided with on the slave trade ships. The Brookes sailed a route between Liverpool, Africa and Jamaica, providing each slave with 6 feet by 1 foot 4 inches of space and 2 feet and 7 inches of headroom.
Source: The British Library, Fast Company
The Atlantic Slave Trade in Two Minutes
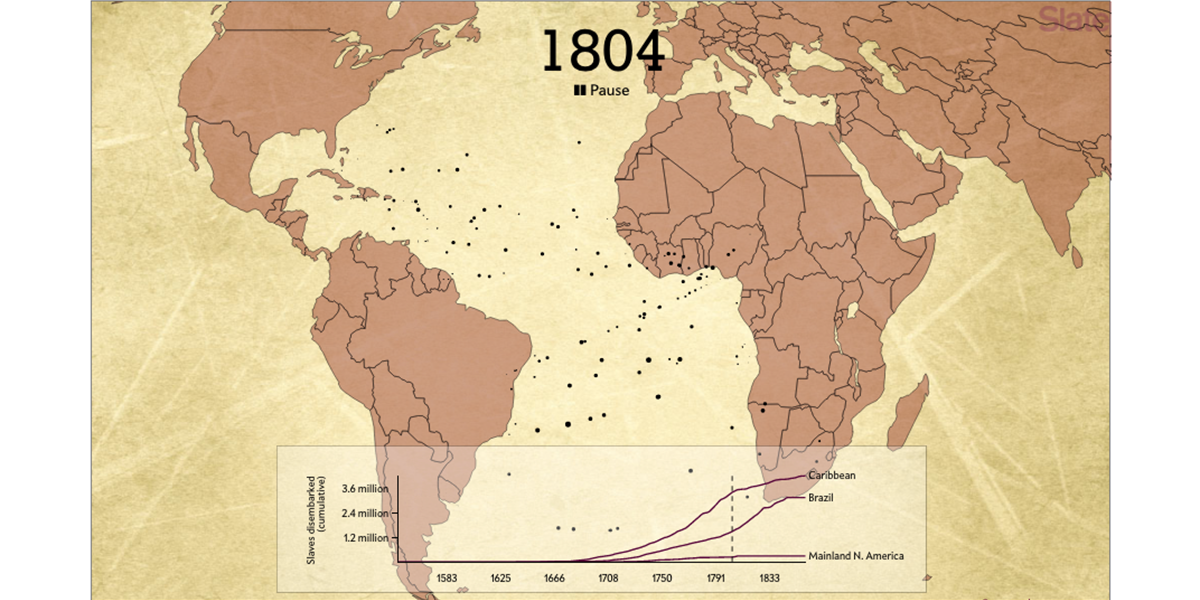
This animation by Slate magazine shows the movement of slaves between Africa, Europe and the Americas, beginning in 1546 and concluding in 1860.
Source: Slate
Visualising Emancipation
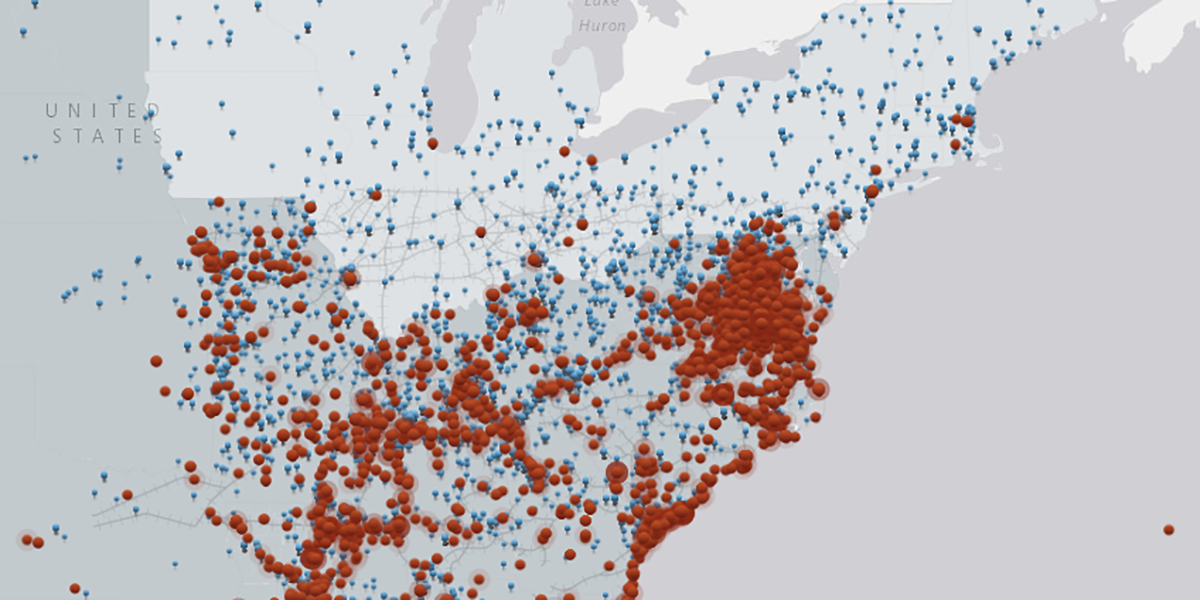
This detailed map of the United States explores the collapse of slavery during the American Civil War (1861-1865). It marks events in the history of slavery, including mentions in the newspaper of runaway slaves, abuse of African Americans, and conscription. The map shows where slavery was legal, and pinpoints the locations of the union army.
Source: University of Richmond
Products of Slavery
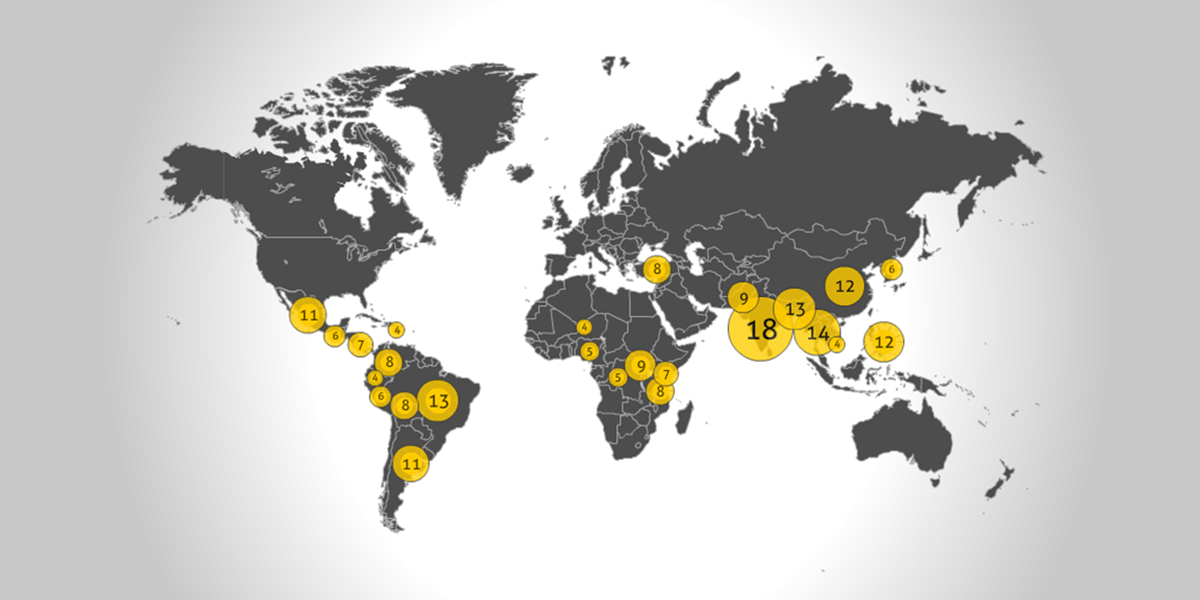
This asset examines modern-day slavery in the form of forced and child labour around the world. The map shows the types of products (such as garments, gems, tobacco, rice and coffee) that are produced through forced labour, and highlights the countries where this occurs.
Source: Anti-Slavery International
No comments yet.