There is a lot of buzz in the media about whether or not Britain should vote to stay in the EU, or if we will vote to exit the union on the referendum date of June 23rd, this year. Coupled some recent negative press around PM David Cameron’s tax affairs, and vocal support for the leave campaign from the likes of Boris Johnson, there is a lot of uncertainty about how the public really feels about the issue.
Many teachers will want to incorporate the debate into their Politics, Economics and Citizenship classrooms. If you are planning to do so, some background and a handy 2 minute animated explainer video that covers how the EU works, can be found on the BBC’s article on the EU referendum.
A spate of visualisations and infographics have appeared in recent weeks, demonstrating the economic impact and attempting to analyse the British public’s opinion on the matter. Here are a few:
A Background Guide to “Brexit” from the European Union
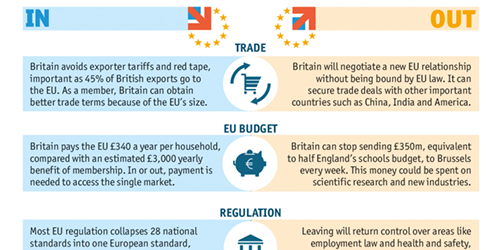
This one, from The Economist, contains an infographic showing the main points of the stay and leave campaigns, alongside some graphs showing market indicators, migration, voting intention and GDP over our time in the EU.
Why a Brexit Could be a Losing Proposition for Everyone
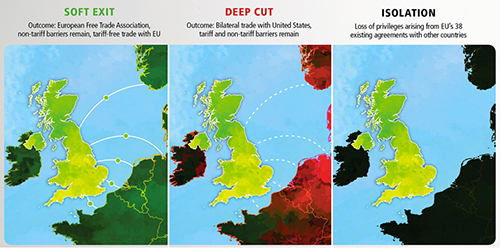
This one, via Visual Capitalist, contains an infographic with trade impact, costs & benefits, and GDP change, as well as a graph showing poll results.
EU Referendum Poll Tracker
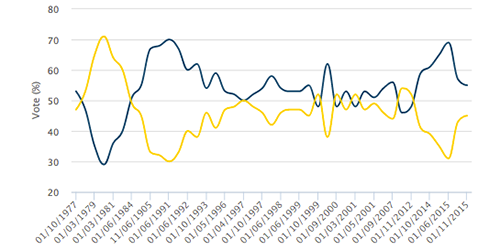
The Telegraph presents historical polling data and explainer videos showing alternatives to EU membership, and campaign key points for the leave and remain arguments.
The Economist’s ‘Brexit’ Poll Tracker
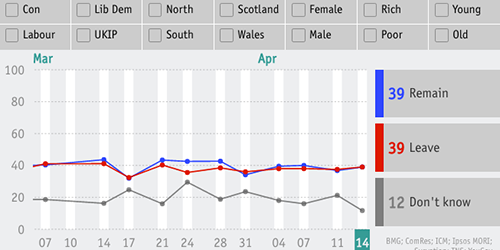
The Economist has begun to track the changes in the polls using this tracker. You can select a demographic group, such as young or old, Wales or Scotland, rich or poor, Lib Dem voters or UKIP voters, to see how the outcome changes.
Of course, these things are never cut-and-dry. The various media outlets and organizations producing this material have political leanings that bring objectivity into question. Certainly, it’s a case of choosing which poll best aligns with their agenda and publishing visualisations using that data. But, this could invoke an interesting discussion in the classroom centring around politics and bias — particularly where the media is concerned — or, simply as an opener to begin discussions about whether ‘Brexit’ would have positive or negative implications for Britain, from an economic and cultural perspective.
What activities and materials have you used to discuss the EU referendum in your classroom? Please share them in the comments.
No comments yet.